Flamegraphs are visual representations of your application's call stack. They help you see exactly where your code spends time during execution.
When your application runs slowly, flamegraphs show you which functions are taking the most CPU cycles, making it easier to find and fix performance problems.
The terms "flame graph" (two words, the original spelling from Brendan Gregg) and "flamegraph" (one word) refer to the same chart. For a Go flamegraph, the canonical workflow is to feed a pprof CPU profile into go tool pprof and render it interactively, no external scripts needed.

This is a flamegraph showing the call stack of a running program.
How to read a flamegraph
- Width represents time - wider boxes mean more CPU time spent in that function
- Height shows the call stack depth - each level is a function call
- Colors help distinguish different functions (varies by tool)
- The widest sections are usually your performance bottlenecks
Most profiling tools let you hover over sections to see function names and timing details.
Generating a Go flamegraph with pprof
The shortest path to a working go pprof flamegraph is to expose the pprof endpoints over HTTP and let the Go toolchain render the chart for you.
While the program is doing real work, capture a 30 second CPU profile and open it in pprof's web UI:
The web UI ships with a Flame Graph view. That is the same kind of chart you saw above, generated from your own program's CPU profile, with no flamegraph.pl or perl scripts in the loop.
For a one-shot benchmark or short-lived program, write the profile to a file with runtime/pprof and pass that file to the same go tool pprof -http command.
Real example: fixing a performance bug
Here's how I used flamegraphs to find and fix a performance issue in an email validation service that was using way more CPU than expected.
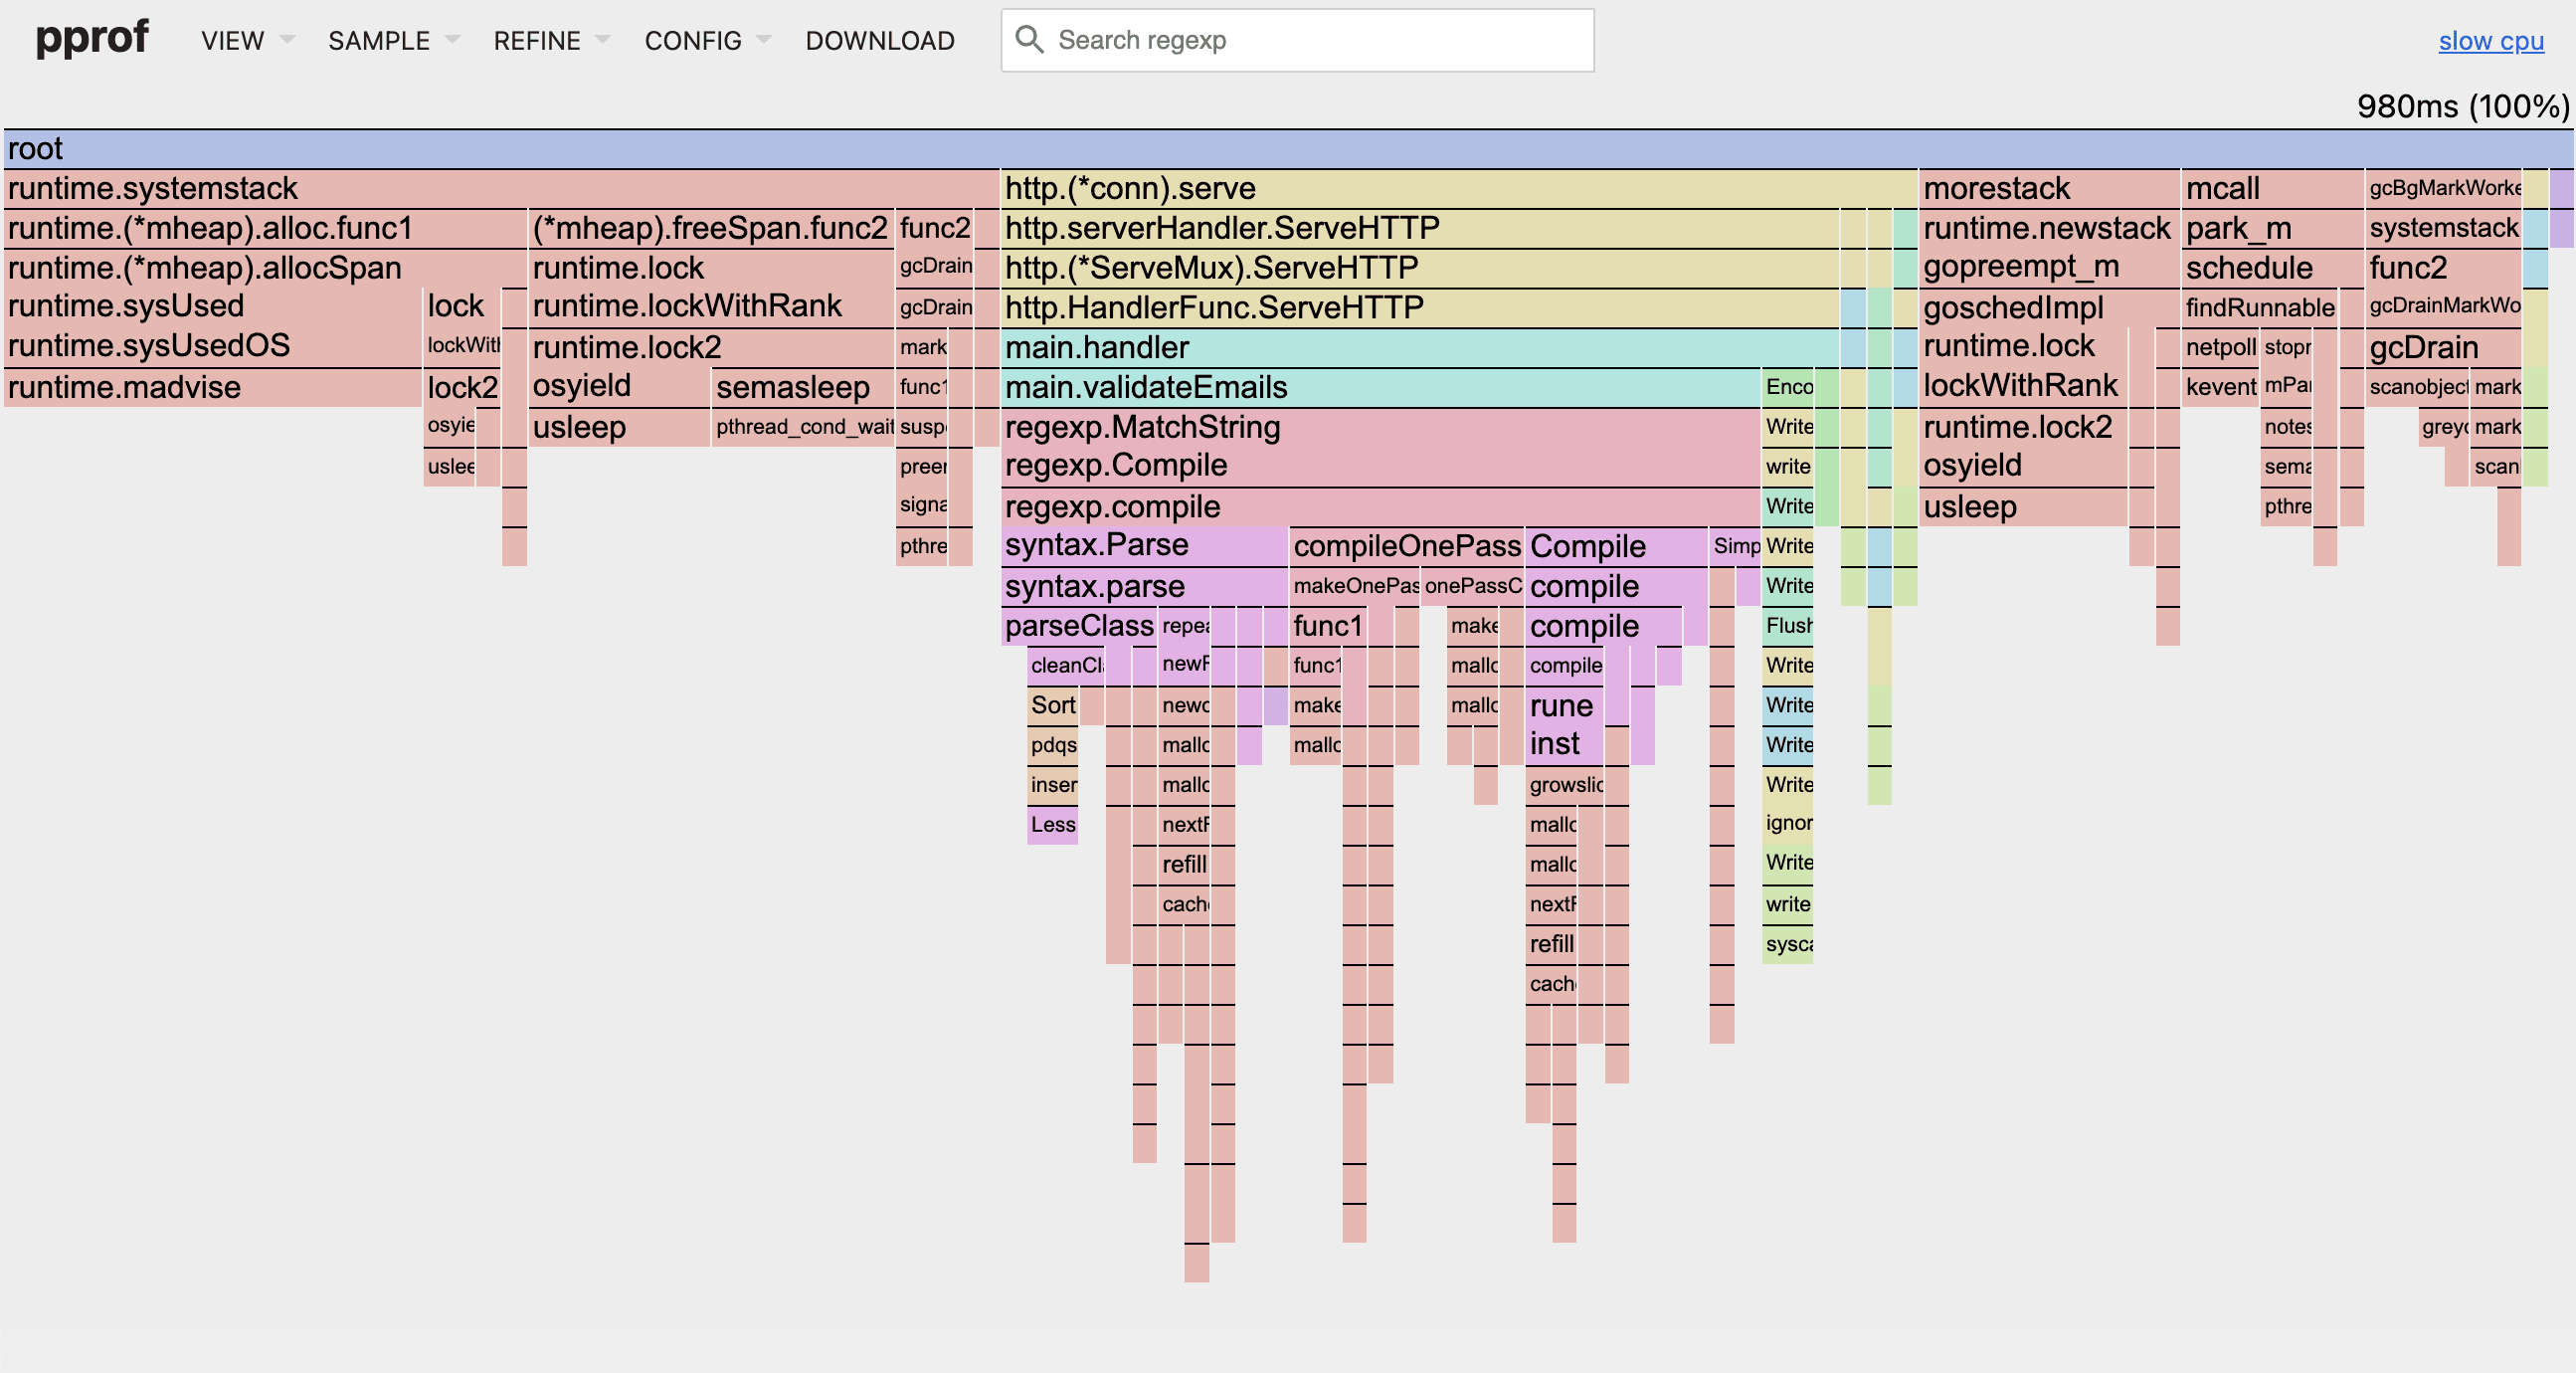
Looking at the flamegraph, you can see wide blocks under regexp.MatchString and specifically regexp.compile calls taking up significant CPU time.
The root cause
The flamegraph shows the issue clearly. Here's the problematic code:
The problem: every call to regexp.MatchString compiles the regex pattern from scratch. For 1000 emails, that's 1000 unnecessary regex compilations.
The flamegraph shows regexp.compile taking way too much CPU time.
The Go documentation clearly states that for performance-critical code, you should pre-compile your regex patterns.
The fix
Here's the optimized version:
Before vs after
Using pprof's -diff_base flag to compare performance:

The differential flamegraph shows the regexp.compile calls have completely disappeared, and CPU usage dropped dramatically.
This simple change resulted in a 10x performance improvement.
Takeaways
- Don't guess where performance issues are, use flamegraphs to show you
- Look for patterns - repeated function calls in hot paths are often the biggest problems
- Read the documentation - most performance issues come from not following best practices
- Always measure before and after to validate your optimizations
Common issues flamegraphs expose
- Regex compilation in loops (like our example)
- N+1 database queries
- Database connections not being reused
- Inefficient string concatenation
- Memory allocations in hot paths
- Blocking I/O in CPU intensive code
Flamegraphs save time by showing you exactly where to look instead of guessing.